Using LoadTest Continuum in DevOps delivery pipeline.

Running performance tests as a part of the continuous delivery pipeline is becoming a best practice in DevOps environments. You can start integrating performance tests into the continuous delivery pipeline by adding selected performance tests to Jenkins or a continuous integration tool of your choice and having them run regularly. Depending on your needs you can run performance tests at one or more of the following points in the build/test infrastructure:
- After each build with a reduced set of performance “smoke” tests.
- Once a day with a more comprehensive set of performance tests.
- Once a weekend or based on infrastructure availability with a set of long running tests for endurance testing or high volume load tests for stress testing.
This by itself, however, is not enough. Manually analyzing load test reports can be time consuming and may require special skills not every developer possesses. Without the ability to automate load test report analysis, reviewing performance test results becomes a tedious time sink. Vital performance information may also get overlooked. In such scenarios you may be running performance tests continuously, but the benefit of them will be limited.
To get the full benefit of continuous performance testing you need to set up an effective mechanism to analyze performance test results. LoadTest and LoadTest Continuum (LTC) provide you with tools that help automate performance tests results collection and analysis and give you insights into the performance of your application. The following steps will help you set up your environment for continuous performance test execution with LoadTest and LoadTest Continuum:
- Review and configure LoadTest project QoS metrics for automation.
- Deploy and configure LoadTest Continuum for load test report collection.
- Configure LoadTest projects into batches for execution.
- Start running LoadTest project batches as a part of continuous integration, and use LoadTest Continuum to regularly review and analyze performance test results.
Review and Configure QoS Metrics for Automation
LoadTest Quality of Service (QoS) metrics are one of the key features for automating the analysis of performance test results. QoS metrics reduce large amounts of data in a load test report to a set of success/failure answers about your application performance. LoadTest offers a rich set of QoS metrics that range from ready-to-use threshold metrics to custom scripted metrics that allow you use the LoadTest API for advanced load test data analysis.
To prepare your performance tests for automation, you need to review the QoS metrics in your LoadTest projects. Run a LoadTest project and examine the report: all success and failure criteria that you use to manually analyze a load test report should be represented as QoS metrics. Convert as many metrics as you can into “numeric” metrics. A numeric QoS metric not only returns a success/failure result, but also provides a number as a key performance indicator for that metric. For instance, a metric that validates a CPU utilization threshold, as a numeric metric would also provide the actual CPU utilization value. Numeric metrics are widely used in Load Test Continuum to plot metric performance over time (See Fig. 1). Once you’ve reviewed the QoS metrics of your Load Test projects, it is time to set up the LoadTest Continuum for performance data collection and analysis.
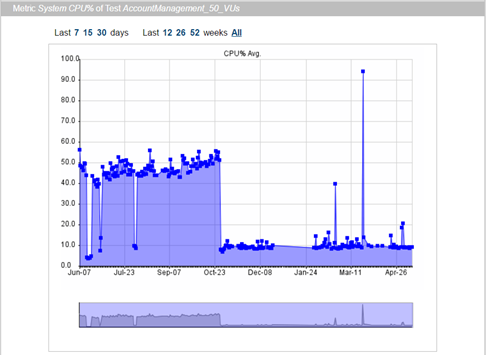
Fig 1. Numeric metric results plotted in Load Test Continuum report.
Deploy and Configure LoadTest Continuum
Deploy and configure the LoadTest Continuum ltc.war Web application archive (available in SOAtest/LoadTest install directory starting with version 9.10.2) as described in the “Load Test Continuum” section of the LoadTest documentation.
Configure LoadTest Projects into Batches for Execution
Combine your LoadTest projects into .cmd scripts for batch execution. Load Test .cmd scripts are how you can specify groups of projects that will make up different sets of performance tests, such as the “smoke” tests, daily tests, or weekend tests mentioned previously.
Configure the .cmd scripts to send report data to LoadTest Continuum as described in the “Sending Reports to Load Test Continuum” section of the LoadTest documentation. Set up your continuous integration tool to run LoadTest .cmd scripts as a part of a build process or at regular intervals. For instance, in Jenkins you can run a LoadTest .cmd script using Execute Windows batch command build step as follows:
"%SOATEST_HOME%\lt.exe" -J-Xmx4096M -cmd -run "%WORKSPACE%\ltcontinuum.cmd"
Use LoadTest Continuum to Review and Analyze Performance Test Results
LoadTest Continuum serves as both a collection point for your LoadTest reports and as an analysis tool that organizes load test data from multiple runs. LoadTest Continuum organizes the data into a pyramid of information that allows you to review your performance test results at various levels of detail: from high-level daily summaries at the top to QoS metrics results at the core, to detailed load test reports at the bottom (See Fig. 2).

Fig. 2. Load Test Continuum daily summary and test metrics view.
Consider the following workflow as an example of a regular (daily) test review:
- Start with checking success/failure summaries of tests and metrics in the main LTC project page.
- For a failed test go through the following steps:
- Open the test History view, check if the test has been failing regularly or sporadically. The first case would likely indicate a regression, the second case - an instability.
- Inspect the failed metrics of the test:
- For a numeric metric open the Metric history graph view. Use metric history graph for insights. For instance: if a test to which the metric belongs is unstable small fluctuations of the metric graph usually indicate that metric threshold needs adjustment. Large fluctuations indicate problems in code or infrastructure.
- Open the All graphs of this test link. Check the graphs of other numeric metrics for the same test for fluctuations that did not cross the metric threshold.
- Do the same for the All graphs of this metric link to check if similar metrics of other tests were affected. If yes, this indicates a systemic issue with your application or infrastructure not limited to a single test (See Fig. 3).
- For a more in-depth analysis open the html or binary Load Test reports of the failed test.

Fig. 3. Load Test Continuum All graphs of the same metric view show performance improvement of the CPU% metric across multiple tests.
Conclusion
To get the full benefit of performance testing as a part of the continuous delivery pipeline you need to set up an effective mechanism for performance test results analysis automation. LoadTest and LoadTest Continuum provide you with features to achieve that goal.
Comments
-
insightful and informative write up of Load Test tools, great explanation, Thoroughly enjoyed reading and a must read blog post for DevOps enthusiasts. I also written few interesting DevOps blogs, Check Once and share your opinion. Thanks in advance.
Regards,
DevOps Online Training Faculty0 -
LoadTest Continuum widget for the DTP.
Parasoft Development Testing Platform (DTP) contains reporting and analytics dashboards that enable you to monitor the health and progress of your software project with a variety of widgets and reports.
A LoadTest Continuum DTP widget allows you to add the most recent load test results summary to your DTP project dashboard and offers a quick way to evaluate the state of the performance test results in your daily project state review routine.
The widget displays the number of total, passed and failed tests and metrics for the most recent LoadTest runs. To view the results in more detail click on the project link in the widget - the LoadTest Continuum page will open in a new tab.
To set up a LoadTest Continuum Custom HTML Widget in DTP follow these steps:
- In DTP Report Center create a new Dashboard or open an existing one.
- Press Add Widget button. In the Add Widget dialog select Custom -> Custom HTML Widget.
- Copy the content of the following file in the LoadTest Continuum installation into the HTML text area of the dialog: %TOMCAT_HOME%\webapps\ltc\dtp\ltc_dtp_widget.html
- Modify the HTML with your custom settings:
- Locate the getServerURL() function. Modify the return value with the host and port of your LoadTest Continuum installation.
- Locate the getProjectName() function. Modify the return value with the name of the project that you would like to track in the widget.
- Press Create button.
1 -
Automatically Load the Most Recent Test Results in LoadTest Continuum.
Load Test 9.10.3 includes an update to LoadTest Continuum (LTC) that helps you automate the task of loading the most recent load test results in LTC. The update eliminates the need to manually click the Reload project data button in the Report Calendar panel of the main page to load the newly available reports. This manual user action can now be automated by sending a project reload request to the LoadTest Continuum.
Most development and test teams use LoadTest Continuum to display the results of automated Continuous Integration (CI) load tests runs. With the new project reload call configured as a CI post build step, your LTC page will always display the most recent load test results.
Use the following command as an Execute shell Jenkins post build step, or send an HTTP GET to the URL below in a tool of your choice to submit a project reload request:
If your Jenkins build agent is running on Windows:
curl -s -o NUL "http://${LTC_HOST}:${LTC_PORT}/ltc/selectProject.jsp?project=${YOUR_PROJECT}&forceReload=true"If your Jenkins build agent is running on Linux:
curl -s -o /dev/null "http://${LTC_HOST}:${LTC_PORT}/ltc/selectProject.jsp?project=${YOUR_PROJECT}&forceReload=true"Replace LTC_HOST and LTC_PORT with the host name and port on which LoadTest Continuum is running. Replace YOUR_PROJECT with the project that Load Test Continuum should reload.
You can find the new ltc.war in the installation root directory of a SOAtest/Load Test 9.10.3 release.
1